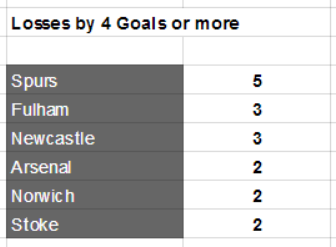
The Story of Spurs’ Season in 10 Graphs and Charts 2 Replies A look at Spurs’ season in picture form. Note: All statistics are for league games as of 04 April 2014. 1. Problems when facing the top teams: Percentage of the 44 goals Spurs have conceded Continue reading →

