I recently took a more maths based look at pass completion percentages and how useful they are in my stats blog. If you’re interested see here. While they don’t seem a very good indicator of success, they do provide a useful idea of a team’s style.
Pass Completion For
Here are the pass completion percentages averaged over the season so far.

Note: I get slightly different numbers than WhoScored.com. This could be because I have decided to average the pass completion per game rather than use aggregated pass numbers.
The two Manchester teams lead the way. Van Gaal plays a possession focused style, while City have some very good passers in their team, so this is no real surprise.
Most of the more accomplished sides feature in the top half of the table, while many of those struggling are near the bottom.
Everton are the exception – 3rd in passing but only 14th in the real table. For a team managed by Roberto Martinez you wouldn’t expect anything less. His team’s problems lie elsewhere.
Despite a supposed change in style, Allardyce’s West Ham sit 16th.
Pass Completion Against
Below are the average pass completion percentages each team has allowed their opponents.
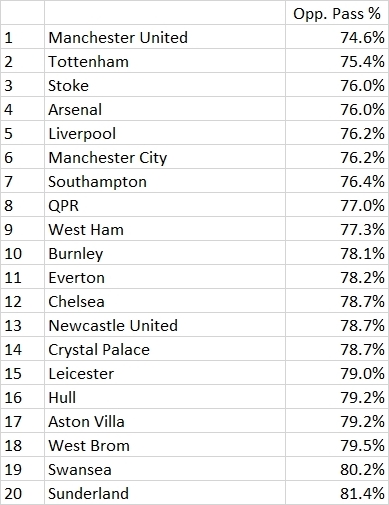
Manchester United and Tottenham Hotspur, the two teams whose managers like to press aggressively, sit 1st and 2nd. You would expect the opposition to find passing more difficult faced with Pochettino and Van Gaal’s tactics.
Mark Hughes’ Stoke are built in their manager’s image, aggressive but in a different way.
Sunderland make passing easiest for their opponents, another indication of their lack of any sort of organisation this season.
Follow me on Twitter: @ABPSpurs
If you have any thoughts on what these statistics tell us let me know in the comments below.
